
Fixed Point Deming Regression
Introduction
Traditionally, linear/polynomial regression approaches assume that all the error is due to the dependent variable. So in the linear case the objective is to minimize the following (simple linear regression):
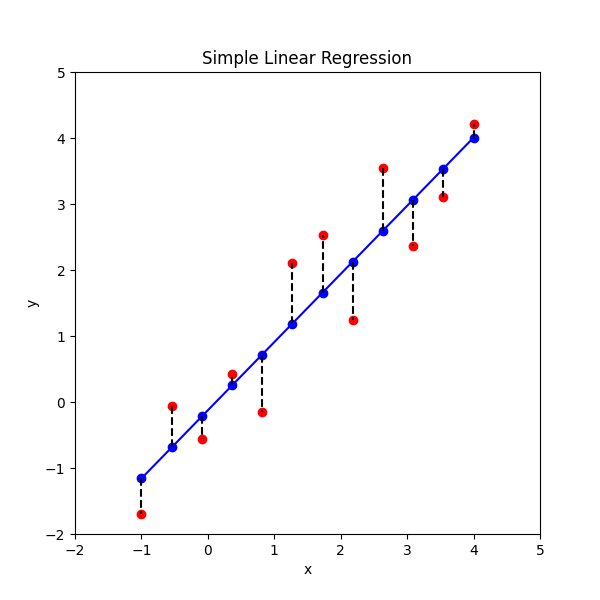
\[S = \sum_{i=1}^{N} (y_i - (mx_i + b))^2\]The independent variable, x is assumed factual (i.e. it has no error). This is often true. Here’s a picture of what this looks like:
>>>


            Code
import os
import matplotlib.pyplot as plt
import numpy as np
plt.rcParams["figure.figsize"] = (6, 6)
save = True
x = np.linspace(-1, 4, 12)
y = x.copy()
np.random.seed(12)
y += 2 * (np.random.random(y.shape) - 0.5)
f = np.poly1d(np.polyfit(x, y, 1))
plt.scatter(x, y, c="r")
plt.scatter(x, f(x), c="b")
plt.plot(x, f(x), c="b")
plt.plot((x, x), (f(x), y), c="k", ls="--")
plt.title("Simple Linear Regression")
plt.xlabel("x")
plt.ylabel("y")
plt.xlim(-2, 5)
plt.ylim(-2, 5)
if save:
rel_path = "assets/images/posts/2021-02-11-fixed-point-deming-regression/simple_least_squares.png"
p = os.path.abspath(os.getcwd())
for i in range(3):
p = os.path.dirname(p)
plt.savefig(os.path.relpath(os.path.join(p, rel_path)))
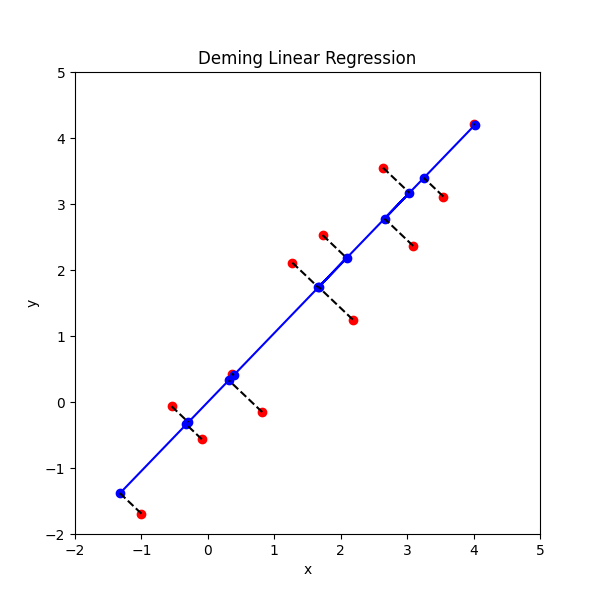
plt.show()However, you can also assume that x and y have some equivalent error contribution. This is known as Deming Regression, where you try to minimize the orthogonal distance between the line of best fit and the (x, y) points. Here’s a picture (Wikipedia):

For my application, I wanted to know how find the Deming regression line when the intercept is fixed at 0 (i.e. b=0). This amounts to minimizing the following (fixed point deming regression):
\[S = \sum_{i=1}^{N} [(y_i - mx_i^*)^2 + (x_i - x_i^*)^2]\]I looked all over for this and couldn’t find a derivation or result. I worked it out and I thought I would share the result. This is probably one of the easier problems in a calculus textbook somewhere, so nothing crazy. :)
Here we go (find \(x_i^*\) which are optimal):
\[S = \sum_{i=1}^{N} [(y_i - mx_i^*)^2 + (x_i - x_i^*)^2]\] \[\frac {\partial S}{\partial x_i^*} = \sum_{i=1}^{N} [-2m(y_i - mx_i^*) - 2(x_i - x_i^*)] = 0\] \[\sum_{i=1}^{N} [m(y_i - mx_i^*) + (x_i - x_i^*)] = 0\] \[\sum_{i=1}^{N} [m y_i - m^2 x_i^* + x_i - x_i^*] = 0\] \[-(1 + m^2) \sum_{i=1}^{N} x_i^* + \sum_{i=1}^{N} (m y_i + x_i) = 0\] \[\begin {equation} \implies \sum_{i=1}^{N} x_i^* = \sum_{i=1}^{N} \frac{m y_i + x_i}{1 + m^2} \tag{1}\label{eq:one} \end{equation}\]Now find the partial with respect to the slope \(m\):
\[\frac {\partial S}{\partial m} = \sum_{i=1}^{N} [2x_i^*(y_i - mx_i^*)] = 0\] \[\begin {equation} \implies m = \frac {\sum_{i=1}^{N} x_i^* y_i}{ \sum_{i=1}^{N} x_i^{*^2}} \tag{2}\label{eq:two} \end{equation}\]Plugging in \eqref{eq:one} to \eqref{eq:two} begets:
\[m = \frac {\sum_{i=1}^{N} (\frac{m y_i + x_i}{1 + m^2}) y_i}{ \sum_{i=1}^{N} \left(\frac{m y_i + x_i}{1 + m^2}\right)^2}\] \[m \sum_{i=1}^{N} {\left(\frac{m y_i + x_i}{1 + m^2}\right)}^2 = \sum_{i=1}^{N} \left(\frac{m y_i + x_i}{1 + m^2}\right) y_i\] \[m \sum_{i=1}^{N} {\left(m y_i + x_i\right)}^2 = \sum_{i=1}^{N} \left(m y_i + x_i + m^3y_i + m^2 x_i\right) y_i\] \[\sum_{i=1}^{N} \left(\xcancel{m^3 y_i^2} + \xcancel{2}m^2 x_i y_i + m x_i^2 \right) = \sum_{i=1}^{N} \left(m y_i^2 + x_i y_i + \xcancel{m^3y_i^2} + \xcancel{m^2 x_i y_i}\right)\] \[m^2 \sum_{i=1}^{N} x_i y_i + m \sum_{i=1}^{N} (x_i^2 - y_i^2) + \sum_{i=1}^{N} (-x_i y_i) = 0\]We have:
\[a = \sum_{i=1}^{N} x_i y_i, \quad b = \sum_{i=1}^{N} (x_i^2 - y_i^2), \quad c = \sum_{i=1}^{N} (-x_i y_i)\] \[\implies m = \frac {-b \pm \sqrt{b^2 - 4 a c}}{2a}\]These yield two values for \(m\). There’s probably some official way to discern the true value of \(m\), but I’m lazy and just pick the one which minimizes \(S\) in our original equation. See the code below.
Result
>>>


            Code
import os
import matplotlib.pyplot as plt
import numpy as np
plt.rcParams["figure.figsize"] = (6, 6)
def deming_reg(x, y):
a = np.sum(x * y)
b = np.sum(np.square(x) - np.square(y))
c = -a
t1 = -b / (2 * a)
t2 = np.sqrt(np.square(b) - 4 * a * c) / (2 * a)
m_pos = t1 + t2
m_neg = t1 - t2
# Probably not mathematically correct to just knock out the summation in equation (1)...
gen_x_star = lambda _m: (1 / (1 + _m ** 2)) * (_m * y + x)
x_star_pos = gen_x_star(m_pos)
s_pos = np.sum(np.square(x_star_pos - x) + np.square(m_pos * x_star_pos - y))
x_star_neg = gen_x_star(m_neg)
s_neg = np.sum(np.square(x_star_neg - x) + np.square(m_neg * x_star_neg - y))
s = s_pos
x_star = x_star_pos
m = m_pos
if s > s_neg:
x_star = x_star_neg
m = m_neg
return x_star, m * x_star
save = True
x = np.linspace(-1, 4, 12)
y = x.copy()
np.random.seed(12)
y += 2 * (np.random.random(y.shape) - 0.5)
x_dem, y_dem = deming_reg(x, y)
plt.scatter(x, y, c="r")
plt.scatter(x_dem, y_dem, c="b")
plt.plot(x_dem, y_dem, c="b")
plt.plot((x, x_dem), (y, y_dem), c="k", ls="--")
plt.title("Deming Linear Regression")
plt.xlabel("x")
plt.ylabel("y")
plt.xlim(-2, 5)
plt.ylim(-2, 5)
if save:
rel_path = "assets/images/posts/2021-02-11-fixed-point-deming-regression/deming_least_squares.png"
p = os.path.abspath(os.getcwd())
for i in range(3):
p = os.path.dirname(p)
plt.savefig(os.path.relpath(os.path.join(p, rel_path)))
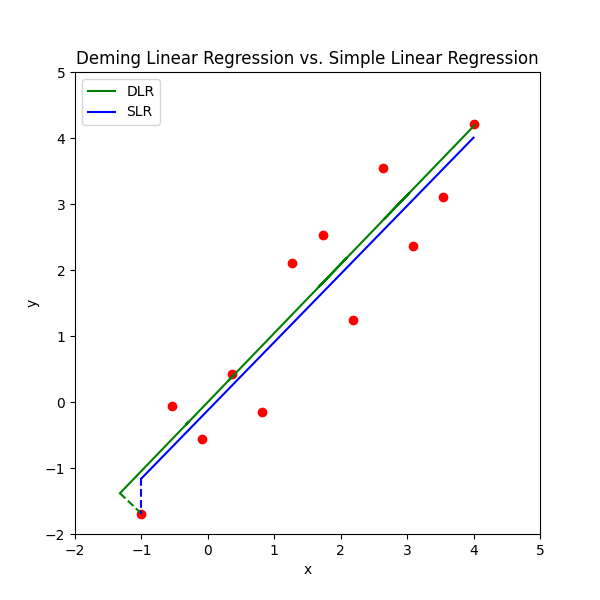
plt.show()Comparison
|
|
>>>


            Code
import os
import matplotlib.pyplot as plt
import numpy as np

plt.rcParams["figure.figsize"] = (6, 6)


def deming_reg(x, y):
    a = np.sum(x * y)
    b = np.sum(np.square(x) - np.square(y))
    c = -a
    t1 = -b / (2 * a)
    t2 = np.sqrt(np.square(b) - 4 * a * c) / (2 * a)
    m_pos = t1 + t2
    m_neg = t1 - t2
    # Probably not mathematically correct to just knock out the summation in equation (1)...
    gen_x_star = lambda _m: (1 / (1 + _m ** 2)) * (_m * y + x)
    x_star_pos = gen_x_star(m_pos)
    s_pos = np.sum(np.square(x_star_pos - x) + np.square(m_pos * x_star_pos - y))
    x_star_neg = gen_x_star(m_neg)
    s_neg = np.sum(np.square(x_star_neg - x) + np.square(m_neg * x_star_neg - y))
    s = s_pos
    x_star = x_star_pos
    m = m_pos
    if s > s_neg:
        x_star = x_star_neg
        m = m_neg
    return x_star, m * x_star


save = True
x = np.linspace(-1, 4, 12)
y = x.copy()
np.random.seed(12)
y += 2 * (np.random.random(y.shape) - 0.5)
x_dem, y_dem = deming_reg(x, y)
plt.scatter(x, y, c="r")
plt.plot(x_dem, y_dem, c="g", label="DLR")
plt.plot((x[:1], x_dem[:1]), (y[:1], y_dem[:1]), c="g", ls="--")


f = np.poly1d(np.polyfit(x, y, 1))
plt.plot(x, f(x), c="b", label="SLR")
plt.plot((x[:1], x[:1]), (f(x)[:1], y[:1]), c="b", ls="--")


plt.title("Deming Linear Regression vs. Simple Linear Regression")
plt.xlabel("x")
plt.ylabel("y")
plt.xlim(-2, 5)
plt.ylim(-2, 5)
plt.legend()
if save:
    rel_path = "assets/images/posts/2021-02-11-fixed-point-deming-regression/vs_least_squares.png"
    p = os.path.abspath(os.getcwd())
    for i in range(3):
        p = os.path.dirname(p)
    plt.savefig(os.path.relpath(os.path.join(p, rel_path)))
plt.show()